I’d seen “R” in job descriptions (usually as “experience with Python or R”), but I didn’t really know what it was.
In the first course I took through Coursera, they had us install R and RStudio.
In short, R is a statistical programming language.
The “about R” page talks about it being a “dialect of S”, an older programming language.
R provides a wide variety of statistical (linear and nonlinear modelling, classical statistical tests, time-series analysis, classification, clustering, …) and graphical techniques, and is highly extensible. The S language is often the vehicle of choice for research in statistical methodology, and R provides an Open Source route to participation in that activity.
Also from the “About R” page:
R is an integrated suite of software facilities for data manipulation, calculation and graphical display. It includes: an effective data handling and storage facility, a suite of operators for calculations on arrays, in particular matrices, a large, coherent, integrated collection of intermediate tools for data analysis, graphical facilities for data analysis and display either on-screen or on hardcopy, and a well-developed, simple and effective programming language which includes conditionals, loops, user-defined recursive functions and input and output facilities.
It’s free and open source and expandable with “packages”. It seems to be very flexible in what it can do.
The first lectures in the R Programming course talk more about the history of the language.
As I mentioned in my first post, I didn’t feel like the lectures really explained what was needed for the course projects. The lectures and associated slides are good for providing some background and an understanding of why you’d want to do certain things, but are not really a how-to, at least not a step-by-step.
Fortunately, the course offered extra credit for doing assignments in the swirl package.
I wouldn’t have had a clue where to start if it wasn’t for this package.
It’s essentially a self-paced tutorial on the language, starting from the very basic (assigning variables) and getting increasingly more complex.
This was more valuable than the lectures, at least to me.
I had a few hiccups where I didn’t understand what was necessary to create a couple of the scripts in the early lessons, but was easily able to find assistance online – there really is a blog for everything!
Right now, I’m trying to decide if buying any books about R would be helpful or if I should be able to mostly rely on material available online.
If you want to get started, you can download R here. You’ll see references to CRAN, which stands for: Comprehensive R Archive Network, which is:
a network of ftp and web servers around the world that store identical, up-to-date, versions of code and documentation for R.
R by itself looks like:
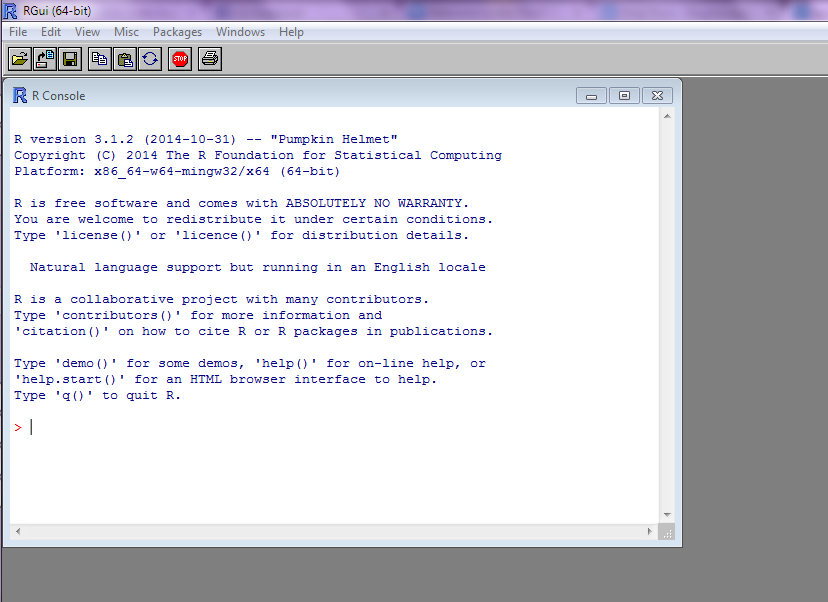
RStudio is a more user-friendly interface for R.
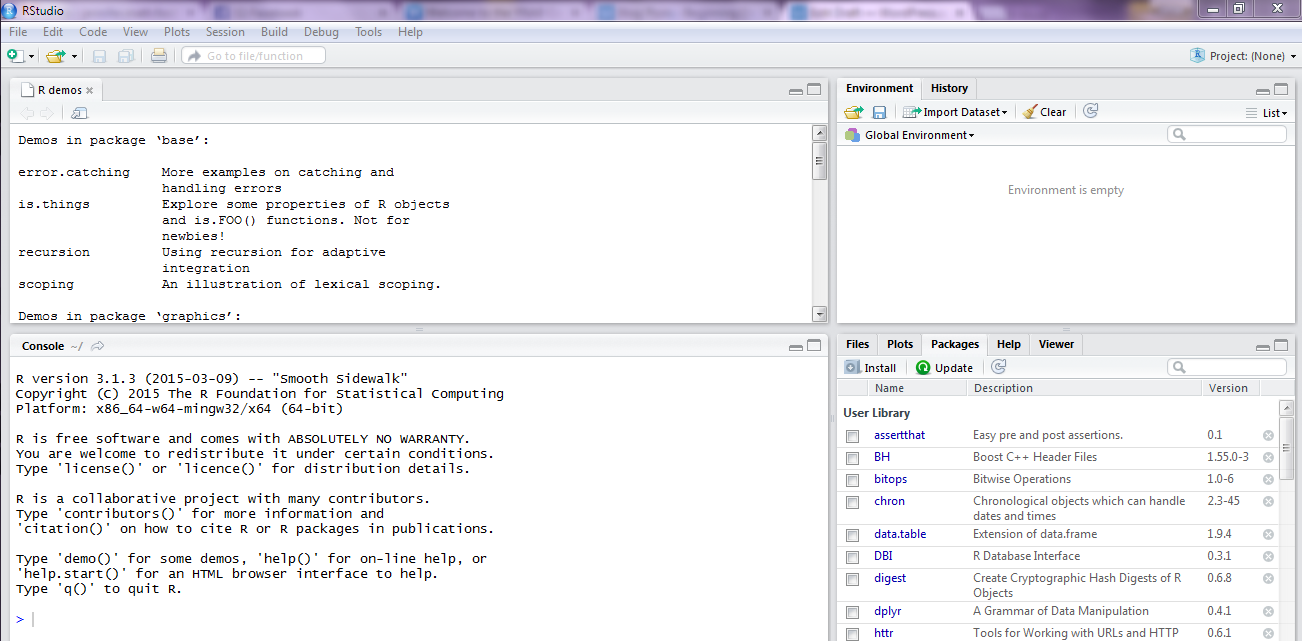
I started doing the first couple of things in the plain R, but moved to RStudio pretty quickly.
To use swirl to start learning R, you have to install the swirl package. There are step-by-step instructions here. (I’m using a Windows 7 machine, so the path name is in Windows).
> install.packages(“swirl”)
Installing package into ‘C:/Users/me/Documents/R/win-library/3.1’
(as ‘lib’ is unspecified)
trying URL ‘http://cran.rstudio.com/bin/windows/contrib/3.1/swirl_2.2.21.zip’
Content type ‘application/zip’ length 132575 bytes (129 KB)
opened URL
downloaded 129 KB
package ‘swirl’ successfully unpacked and MD5 sums checked
The downloaded binary packages are in
C:\Users\me\AppData\Local\Temp\Rtmp08B97X\downloaded_packages
After it’s installed, you have to activate it by calling it from the library.
> library(“swirl”)
| Hi! Type swirl() when you are ready to begin.
And then it’s just a matter of following the directions.
swirl()
| Welcome to swirl!
| Please sign in. If you’ve been here before, use the same name as you did then. If you are new,
| call yourself something unique.
What shall I call you?
